UNDERSTANDING THE DUTY & OPERATING POINTS IN FAN CURVES
This page is designed to help you to determine the operating point using a system curve and a static fan curve. If you’ve not yet read up on how to read a performance fan curve and know how they are produced, we suggest before reading this post, that you familiarise yourself with fan curves by visting the article in our technical information pages.
Engineers and designers who select and specify fans should have a good basic knowledge of fan curves and an understanding of how these are produced is vital for verifying the original fan selection, trouble shooting after the installation, and understanding future flexibility. Fan curves are simply graphs showing fan performance, normally with air volume on the horizontal “x” axis, and pressure on the vertical “y” axis. To obtain a fan curve the fan is placed in a test rig in which air pressure and volume can be measured and the pressure can be varied by adjusting a damper or venturi of known characteristics. For a fan driven by an electric motor, the input voltage remains the same throughout the test.
Why do we need to find the Operating Point?
The manufacturers of filters, heating and cooling coils etc are usually able to give a static pressure drop for their product at a stated airflow, and for ducting, standard charts are available to identify the resistance per metre of different duct sizes at different airflows.
Standard factors are available to calculate the pressure drop caused by bends and other restrictions in ducting, and the discharge dynamic pressure is easily calculated.
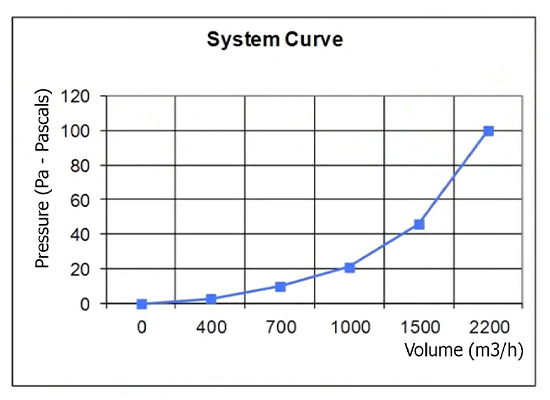
Using the second fan law, we can calculate the resistance of each element at the required duty point, or air volume, and the sum of these resistances at the duty point and a number of other volumes. Plotting these points on a volume/pressure graph we create a “System Curve”. This will be a square curve.
The System Curve
The system curve is the resistance created at a set number of air volumes.
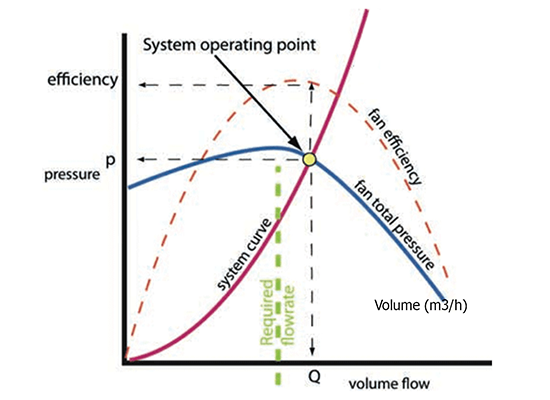
What Is The Operating Point?
We can now superimpose on this graph the fan curve for the fan we propose to use, the point where the fan curve and system curve meet is called the Operating Point and represents the airflow and pressure we will achieve in that system with that fan.
Free Air & Cut Off in Fan Curves
The pressure is varied between zero, when the fan delivers its maximum volume, this point is known as “free air”, and by stages up to the point when the fan moves no air and develops maximum pressure. This is often referred to as “cut off” or “shut off”.
At each pressure the volume is noted and the “operating points” are plotted on a graph, these are then joined with a line and then become the “fan curve”.
The curve below is a static curve, some manufacturers show total pressure which includes velocity pressure at the fan discharge. On a normal graph the various curves would be shown alongside one another.n be varied by adjusting a damper or venturi of known characteristics. For a fan driven by an electric motor, the input voltage remains the same throughout the test.
Fan Performance Tables
Manufacturers typically publish catalogues containing performance or rating tables for each specific fan size. These tables are printed in a compact format, showing only the minimum information necessary to select a fan to match a desired performance. Performance tables are very easy to use for making an initial selection.
Static Pressure
Signed as Pst or sometimes on fan curves as Pfa. This is the difference in pressure either across an element in the system. For example a carbon filter or a heating coil, or between the inside of the system and outside atmosphere. Static pressure can be either positive or negative.
Dynamic Pressure
Usually signed as pD or PDy. As the name suggests, this is pressure created by the movement of air. It increases as velocity increases and is always positive.
Total Pressure
Usually signed as Pt ot pT. This is the sum of all the static elements plus the dynamic pressure at the discharge:
Pt = Pst + pD
Many people are confused over total pressure and only total pressure and only include the sum of the static elements, calling this “the total pressure drop” but when using total pressure curves you must always add the dynamic pressure due to the velocity at the discharge from the system. For example, at 10 metres per second discharge velocity Pd is 60 Pascals.
At Axair, our technical engineers have a wealth of experience in both fan selection and technical expertise. If you require assistance selecting an operating point or duty point on a fan curve of system curve, contact us on 01782 349 430. For more information visit our technical information page.